Introduction
If you’ve ever looked at a price chart and thought, “It’s going up… or maybe it’s just bouncing around,” you’re already thinking about trends. A trend is simply the general direction a market is moving over time. Understanding it can make trading feel less like guessing and more like reading a story that price is telling.
Trends matter because most beginner mistakes happen when people trade against the market’s direction. They buy in a falling market because “it looks cheap,” or they sell too early in a rising market because they’re afraid it will drop. Learning to spot trends won’t guarantee profits, but it can help you avoid many unnecessary losses and reduce confusion.
In this article, we’ll break down what a trend is, the main types of trends, practical ways to identify them, and common mistakes traders make when working with trends—all in a simple, beginner-friendly way.
If you remember just one thing: trend trading is about aligning your decisions with the market’s direction, not predicting the exact top or bottom.
What Is a Trend in Trading?
A trend in trading is the overall direction of price movement over a period of time. It doesn’t mean price moves in a straight line—markets rarely do. Instead, price typically moves in waves: it pushes forward, pulls back, then pushes again. When those waves generally move higher, we call it an uptrend. When they move lower, it’s a downtrend. When they don’t show a clear direction, it’s sideways.
A simple way to think about it:
An uptrend means price is generally making higher highs and higher lows.
A downtrend means price is generally making lower highs and lower lows.
A sideways trend (range) means price is mostly moving between a top and bottom level without a clear direction.
A trend is not “one big move.” It’s a pattern of movement that becomes clearer when you zoom out and give it time.
Types of Trends
Uptrend (Bullish Trend)
An uptrend happens when buyers are in control and price keeps moving upward over time. You’ll often see price rise, pull back a bit, then rise again.
Key features of an uptrend:
Higher highs (each new peak tends to be above the last one)
Higher lows (pullbacks don’t fall as low as the previous pullbacks)
Pullbacks are usually temporary pauses, not full reversals

In an uptrend, beginners often try to “sell the top.” A simpler approach is to look for buy opportunities during pullbacks—when price temporarily dips inside the trend.
Downtrend (Bearish Trend)
A downtrend is the opposite: sellers are stronger than buyers, and price generally moves downward over time. You’ll often see price drop, bounce a little, then drop again.
Key features of a downtrend:
Lower lows (each new low tends to be below the last one)
Lower highs (bounces fail to reach previous highs)
Rallies are often brief compared to the drops

In a downtrend, many beginners keep buying because “it has to bounce.” Markets can fall longer than you expect. It’s often safer to wait for a clear trend change rather than guessing a bottom.
Sideways Trend (Range / Consolidation)
A sideways trend happens when price moves within a horizontal “box.” Buyers and sellers are roughly balanced, and the market is deciding what to do next.
Key features of a range:
Price repeatedly bounces between support (bottom area) and resistance (top area)
No consistent higher highs or lower lows
Breakouts can happen, but many breakouts fail

Sideways markets often punish trend-following strategies. If you like trend trading, it’s okay to step aside during choppy ranges. Not trading is also a decision.
How to Identify a Trend (Practical Methods)
There’s no single “perfect” method. Many traders combine a few simple tools to confirm what they’re seeing. Below are beginner-friendly ways to identify trends without making things too complicated.
1) Use Market Structure: Highs and Lows
This is the most important method because it’s based on price itself, not an indicator.
Uptrend: higher highs + higher lows
Downtrend: lower highs + lower lows
Range: highs and lows stay within a horizontal zone
How to do it on a chart:
Zoom out (start with a higher timeframe like 4H or daily if you’re swing trading).
Identify swing highs (peaks) and swing lows (valleys).
Compare the most recent highs and lows to earlier ones.
If you can read highs and lows, you can read trends—even without any indicators.
Mark only the clearest swings. Beginners often mark every tiny wiggle, which creates confusion.
2) Draw Trendlines (The Simple Way)
Trendlines help you visualize the direction and the “angle” of a trend.
Basic rules:
In an uptrend, draw a line connecting at least two higher lows (three touches is stronger).
In a downtrend, draw a line connecting at least two lower highs.
The more times price respects the line, the more useful it becomes.

Common beginner mistake: forcing a trendline to fit.
A trendline should describe the market, not “make it look trending.”
If your trendline is broken and price fails to return above it (in an uptrend), treat that as a warning sign—not instant proof of reversal.
3) Use Moving Averages (A Beginner-Friendly Indicator)
Moving averages (MAs) smooth out price data so you can see direction more clearly. They are not perfect, but they can help beginners avoid overthinking.
Common ways to use them:
If price is mostly above the MA and the MA slopes upward → uptrend bias.
If price is mostly below the MA and the MA slopes downward → downtrend bias.
If the MA is flat and price crosses it often → sideways/choppy market.
Popular simple choices:
20-period MA for short-to-medium trend feel
50-period MA for medium trend
200-period MA for long-term trend context

Don’t treat moving averages like magical support/resistance. Use them as a trend filter—a quick way to reduce bad trades.
4) Check Multiple Timeframes (Top-Down View)
A trend can look different depending on the timeframe. A market might be in a long-term uptrend but a short-term downtrend (a pullback).
A simple top-down approach:
Identify the main trend on a higher timeframe (e.g., daily).
Look for entries on a lower timeframe (e.g., 4H or 1H) in the direction of the higher timeframe trend.
Example:
Daily chart: uptrend
4H chart: currently pulling back
You wait for the 4H pullback to end and then look for buy setups aligned with the daily uptrend
Higher timeframes usually have more “authority” than lower ones.
Beginners often do the opposite: they obsess over small timeframes and get whipsawed. Start higher, then zoom in.
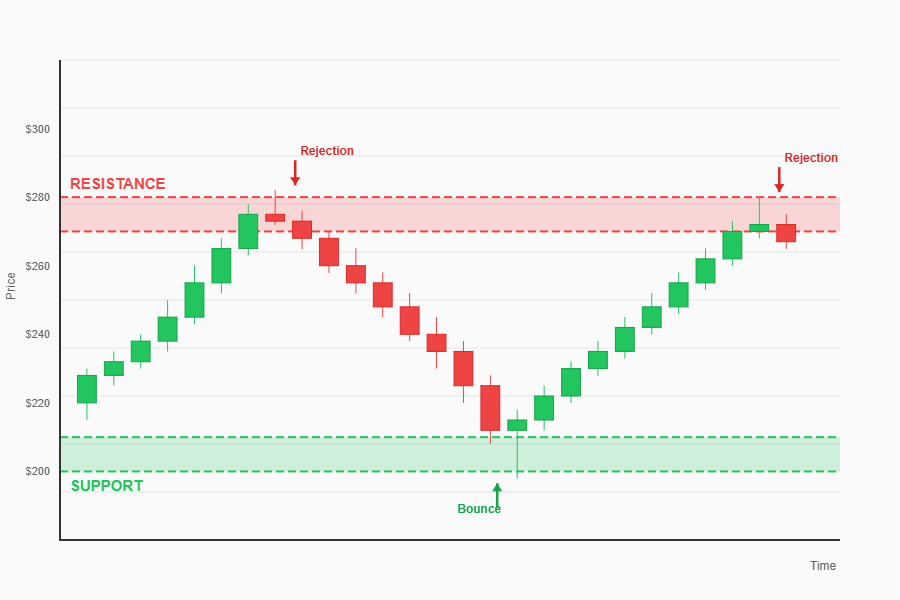
5) Use Support and Resistance to Confirm Direction
Support and resistance are areas where price often reacts.
How they help with trends:
In an uptrend, old resistance can become new support (a classic bullish sign).
In a downtrend, old support can become new resistance (a classic bearish sign).

This method is powerful because it connects trend direction to real market behavior: break, retest, continue.
Draw zones, not perfect lines. Price often reacts in an area, not at one exact number.
6) Spot Trend Strength (So You Don’t Chase Weak Moves)
Not all trends are equal. Some trends are smooth and healthy; others are weak and noisy.
Simple signs of a stronger trend:
Pullbacks are shallow and controlled
Price respects a trendline or moving average repeatedly
Breakouts hold and don’t immediately reverse
Simple signs of a weaker trend:
Price constantly spikes up and down (choppy)
Breakouts fail often
No clear swing structure (highs/lows are messy)
If the market looks messy, it often means your edge is lower.
If you can’t explain the trend in one sentence (“Uptrend with higher highs/higher lows”), consider staying out.
Common Mistakes Beginners Make
Even with good tools, beginners often fall into predictable traps. Here are the big ones—and how to avoid them.
1) Confusing a Pullback With a Reversal
In an uptrend, price drops sometimes. That does not automatically mean the trend is over.
What helps:
Look at structure: is it still making higher lows?
Use a higher timeframe to see if the move is just a normal correction
Wait for confirmation (e.g., a break of structure) before declaring a reversal
A pullback is a “pause.” A reversal is a “change of direction.” Don’t treat them as the same thing.
2) Drawing Too Many Lines and Indicators
Beginners often add more tools when they feel uncertain. The chart becomes crowded, and decisions become slower and less clear.
Better approach:
Start with price structure (highs/lows)
Add only one helper tool (like a moving average or trendline)
Keep support/resistance zones simple
More indicators rarely means more clarity. It often means more conflict.
3) Trading Against the Trend Because “It’s Overextended”
A market can stay “overbought” or “oversold” longer than you think. Counter-trend trades may work sometimes, but they’re harder for beginners because timing is critical.
Safer beginner mindset:
In an uptrend, focus on buy setups
In a downtrend, focus on sell setups (or stay out if you don’t short)
In a range, either trade the range carefully or wait for a breakout and retest
Trend trading is like swimming with the current. Counter-trend trading is like swimming against it—you need more skill and energy.
4) Ignoring the Timeframe They’re Actually Trading
A common issue: someone enters a trade on a 5-minute chart but manages it emotionally based on a 1-minute chart (or expects a 5-minute trade to behave like a daily trade).
Fix it:
Choose your trading timeframe first
Use one timeframe higher for context
Use one timeframe lower only if it helps entries (optional)
Your trend analysis should match your holding time.
5) Calling Every Breakout a Trend
Sometimes price breaks a level and then immediately returns. These are false breakouts, and they happen a lot—especially in sideways markets.
How to reduce false signals:
Wait for a close above/below the level, not just a quick spike
Look for a retest (break → pull back → hold)
Confirm with structure (does the breakout create a new higher high / lower low?)

A breakout is a signal, not a guarantee. Waiting for confirmation may reduce opportunities, but it often improves quality.
Conclusion
A trend is the market’s general direction over time, shown through a pattern of price movement. For beginners, the simplest way to identify a trend is to look at market structure: higher highs and higher lows for an uptrend, lower highs and lower lows for a downtrend, and sideways movement within a range for consolidation.
To make your trend analysis more reliable, you can combine a few tools: trendlines to visualize direction, moving averages as a trend filter, support and resistance for confirmation, and multiple timeframes to keep perspective. Most importantly, avoid common mistakes like fighting the trend, confusing pullbacks with reversals, and overloading your chart with indicators.
You don’t need to predict the future to trade trends—you need to recognize what the market is already doing and align with it.
Practice idea: open any chart, pick one timeframe, and label the last 20 swing highs/lows. Then write one sentence: “The market is in an uptrend/downtrend/range because…” Do this daily for a week—you’ll improve fast.